Population and Sample: Understanding Statistical Inference
- In the below picture-1, there is a gathering of millions of people.

- If we want to take the opinion of all these people about the opinion about voting in an election for A, B & C Political parties. We will face the below problems.
- It will require an infrastructure to take the opinion
- Financially it will be very costly
- It will be very time-consuming to contact each & every person
- Practically it does not seem feasible.
How to overcome the practical constraints and get meaningful information?
Solution:-
- In place of contact with each & every person, we will select a small group of persons. Refer to the yellow rectangles in the below photograph.

- Talk to these selected groups of people only (inside the Yellow rectangle) for conducting an opinion poll.

- Conduct an opinion poll of people in the selected groups (Yellow rectangles).

- Compile opinion poll data and derive voting patterns (an example).
Sample opinion:-
-
-
-
- Party A – 48% voting
- Party B – 27% voting
- Party C – 19% voting
- Do not know – 6%
-
-
- Now we will assume that a whole gathering of millions of people (Picture-1) have the same opinion as the Sample opinion.
Population opinion: –
-
-
-
- Party A – 48% voting
- Party B – 27% voting
- Party C – 19% voting
- Do not know – 6%
-
-
Statistics: Population definition
- Population is the set of all individuals of interest in a particular study.
- As mentioned in Case Study (A), the gathering of people may be treated as POPULATION in statistics terminology.

Example 2: In the below word map children’s populations on Earth are shown as a red dot. All the children will be treated as a Population under statistical study.

- In most cases, the Population is very large in number. Therefore it becomes practically impossible to evaluate every child of the population. (Due to financial, resource & time constraints, etc)
- Therefore samples are selected for the study. Sample statistical analysis helps to predict population behavior.
Statistics: Sample definition
- A sample is a subgroup of the population.
- A group of individuals selected from a population is called a sample.
- In Example 2 :
- One vaccine has been developed for children. Now we are going for the trial of this vaccine on children. We cannot do a trial on the entire children population. Therefore we will select children for trial. In the below figure, green circles represent children selected as samples for a vaccine trial.

- The sampling method is economical and less time-consuming.
- A sample is intended to be representative of its population.
- The outcome from samples is considered as an outcome of the population.
- However, there is a certain amount of error when inference is drawn from the sample. This error is known as sampling error.
Statistics Sampling error
- Sampling error is the naturally occurring discrepancy, or error, that exists between a sample statistic and the corresponding population parameter
- A sampling error is a statistical error that occurs when an analyst does not select a sample that represents the entire population of data. As a result, the results found in the sample do not represent the results that would be obtained from the entire population.


Also Read
- https://matistics.com/statistics-data-variables/
- https://matistics.com/descriptive-statistics/
- https://matistics.com/1-1-measurement-scale/
- https://matistics.com/point-biserial-correlation-and-biserial-correlation/
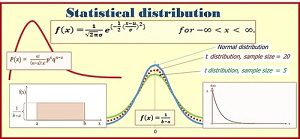
- https://matistics.com/2-0-statistics-distributions/
- https://matistics.com/1-2-statistics-population-and-sample/
- https://matistics.com/7-hypothesis-testing/
- https://matistics.com/8-errors-in-hypothesis-testing/
- https://matistics.com/9-one-tailed-hypothesis-test/
- https://matistics.com/10-statistical-power/
- https://matistics.com/11-t-statistics/
- https://matistics.com/12-hypothesis-t-test-one-sample/
- https://matistics.com/13-hypothesis-t-test-2-sample/
- https://matistics.com/14-t-test-for-two-related-samples/
- https://matistics.com/15-analysis-of-variance-anova-independent-measures/
- https://matistics.com/16-anova-repeated-measures/
- https://matistics.com/17-two-factor-anova-independent-measures/
- https://matistics.com/18-correlation/
- https://matistics.com/19-regression/
- https://matistics.com/20-chi-square-statistic/
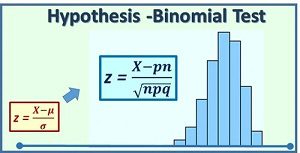
- https://matistics.com/21-binomial-test/