What is t-Statistics for two Related Samples?
- A design that uses two sets of data that are obtained from the same group of participants, is called a repeated-measures research design or a within-subjects design.

Essential background: Review the below section before proceeding.
- Introduction to the t statistic
- Estimated standard error
- Degrees of freedom
- t Distribution
- Hypothesis tests with the t statistic
- Independent-measures design
Related Samples: Same group of participants
- The two sets of data could come from the same group of participants.
- The study may involve one set of JEE scores (data) by collecting a sample of students when they appeared in the 12th Standard Board Exam and also in JEE Exam.
- And the second set of JEE scores (data) by collecting a sample of the same students when they also appeared in JEE exam a second time after passing the 12th Standard.
Repeated-measure design or a within-subjects design
- In a related-sample research study, the individuals in one treatment condition are directly related, one-to-one, with the individuals in the other treatment condition(s).
- The most common related samples study is a repeated-measures design, in which the same sample of individuals is tested in all of the treatment conditions. This design literally repeats measurements on the same subjects.
- An alternative is a matched subject design, in which the individuals in one sample are matched one-to-one with individuals in another sample. The matching is based on a variable relevant to the study.
The Matched-Subjects Design
- In a matched-subjects study, each individual in one sample is matched with an individual in the other sample.
- The matching is done so that the two individuals are equivalent (or nearly equivalent) with respect to a specific variable that the researcher would like to control
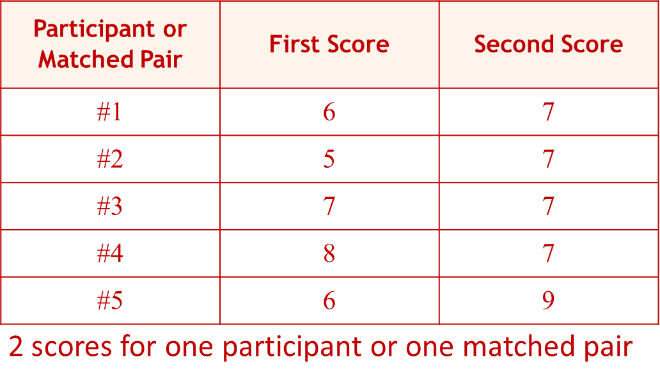
The Matched-Subjects Design: Example
Difference Scores: The Data for a Repeated-Measures Study
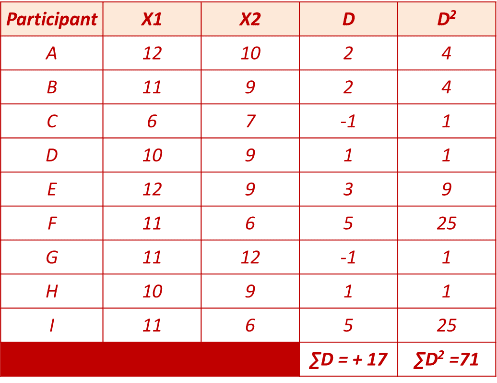
- There is one sample of n = 10 participants for a medical test,
- Each individual is measured twice.
- The first score for each person (X1) is measured after I hour of taking medication.
- The second score for each person (X2) is measured after 2 hours of taking medication.
Difference in score D = X2 − X1
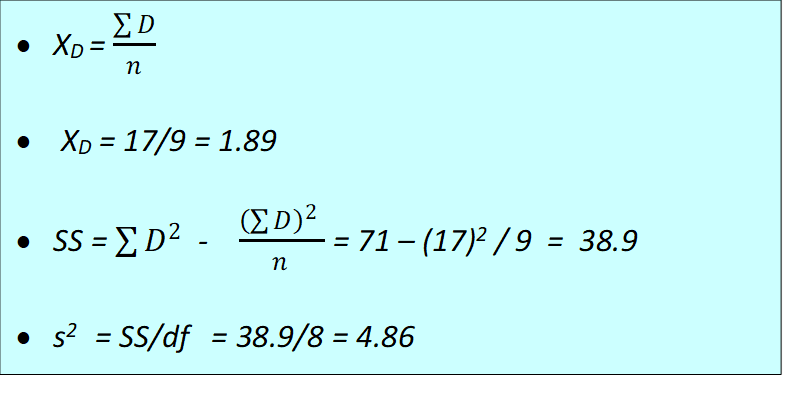
- The mean of samples D scores (MD) and the value of SS for the sample of D scores MD

The Hypothesis for a Related-Samples Test
Null hypothesis
- The null hypothesis states that there is no effect, no change.
- Repeated-measures study: null hypothesis states that the mean difference for the general population is zero.
H0 : µD = 0
The alternative hypothesis
- The alternate hypothesis states that there is a treatment effect that causes the scores in one treatment condition to be systematically higher (or lower) than the scores in the other condition.
H1 : µD ≠ 0
Formula: t Statistic for Related Samples

and
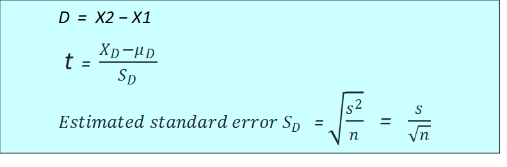

- A difference score (D value) is computed for each person and the hypothesis test uses the difference scores from the sample to evaluate the overall mean difference, µD, for the entire population.
- The hypothesis test with the repeated-measures t statistic follows the same four-step process that we have used for other tests
Step 1: State the hypotheses, and select the alpha level.
Step2: Locate the critical region
- Select α level
- calculate df
- Decide critical values as per α and df values
In the above example
- n = 9 , use α = .05
- df = 9-1 = 8
- for α = .05, df =8, critical value t from the distribution table is ±2.306
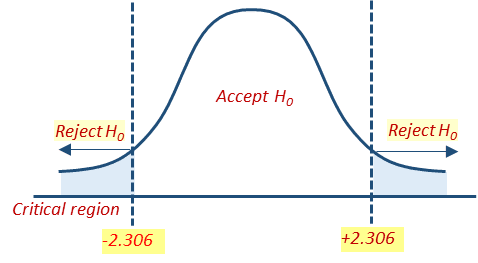
Step3: Calculate the t statistic

Step4: Make a decision
- t calculated from the above example data is 2.572
- It is greater than t critical =2.306 and It falls inside the critical region.
- Therefore Null hypothesis Ho is rejected
- and it is concluded that there is NO significant difference in scores.

Assumptions of the Related-Samples t-Test
The related-samples t statistic requires two basic assumptions.
- The observations within each treatment condition must be independent.
- The population distribution of difference scores (D values) must be normal.
Treatment effect Size estimation by Cohen’s d for dependent Measurement t-test –Two Sample

Effect measurement is defined by Cohen’s d
- Population mean and standard deviation are unknown, we use the sample values instead. The sample mean, XD, is the best estimate of the actual mean difference, and the sample standard deviation (square root of sample variance) provides the best estimate of the actual standard deviation. Estimate the value of d :

Treatment effect Size estimation by r2 for dependent Measurement t-test –Two Sample
- A second common measure of effect size is the percentage of variance accounted for by the treatment effect.

Confidence Intervals for estimating 𝛍D for dependent Measurement t-test –Two Sample
- Confidence interval is an alternative method for measuring and describing the size of the treatment effect.
- Sample mean difference XD is used to estimate the population mean difference µD
µD = XD ± t * s

Reporting the Results of an Independent-Measures t-Test
- There is a prescribed format for reporting the calculated value of the test statistic,
- Degrees of freedom,
- α Alpha level for the t-test.
- t value
- CI
- P- probability value – acknowledges the possibility/probability of a Type I error
Summary
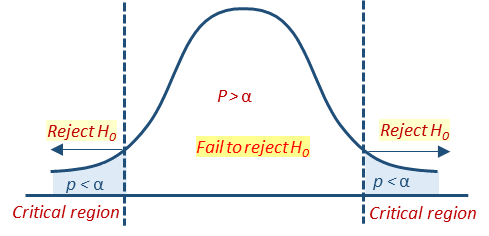
- Sample means that falls in the critical region (shaded area) have a probability less than alpha (p < α). And the null hypothesis should be rejected.
- Sample means that do not fall in the critical region have a probability greater than alpha (p > α).

-
- difference between p < .05 and p > .05 ??
- A significant result that rejects the null hypothesis corresponds to p < .05 or p < α
Also Read
- https://matistics.com/statistics-data-variables/
- https://matistics.com/descriptive-statistics/
- https://matistics.com/1-1-measurement-scale/
- https://matistics.com/point-biserial-correlation-and-biserial-correlation/
- https://matistics.com/2-0-statistics-distributions/
- https://matistics.com/1-2-statistics-population-and-sample/
- https://matistics.com/7-hypothesis-testing/
- https://matistics.com/8-errors-in-hypothesis-testing/
- https://matistics.com/9-one-tailed-hypothesis-test/
- https://matistics.com/10-statistical-power/
- https://matistics.com/11-t-statistics/
- https://matistics.com/12-hypothesis-t-test-one-sample/
- https://matistics.com/13-hypothesis-t-test-2-sample/
- https://matistics.com/14-t-test-for-two-related-samples/
- https://matistics.com/15-analysis-of-variance-anova-independent-measures/
- https://matistics.com/16-anova-repeated-measures/
- https://matistics.com/17-two-factor-anova-independent-measures/
- https://matistics.com/18-correlation/
- https://matistics.com/19-regression/
- https://matistics.com/20-chi-square-statistic/
- https://matistics.com/21-binomial-test/