Introduction to t-Statistic
- The t statistic is used to test hypotheses about an unknown population mean, μ, when the value of σ is unknown.
- The formula for the t statistic has the same structure as the z-score formula, except that the t statistic uses the estimated standard error in the denominator
- The estimated standard error is used as an estimate of the real standard error when the value of population σ is unknown.
![]()

- The only difference between the t formula and the z-score formula is that the z-score uses the actual population standard deviation σ and the t formula uses the corresponding sample standard deviation when the population value is not known.
Hypothesis: t- Statistic in place of z score
t- Statistic is used in place of Z score in the hypothesis to avoid the following shortcomings:
- Statistical procedures permit to use of a sample mean to test hypotheses about an unknown population mean.
- A sample mean (μx) is expected to approximate its population mean (μ). This assumption permits us to use the sample mean to test a hypothesis about the population mean.
- A z-score requires the value of the population standard deviation (or variance), which is needed to compute the standard error. In most cases, the standard deviation for the population is not known.
- It creates a paradox: You want to use a z-score to find inferences about an unknown population but to calculate a z-score you require the standard deviation of the population.
Degree of Freedom
Degrees of freedom describe the number of scores in a sample that are independent and free to vary. Because the sample mean places a restriction on the value of one score in the sample, there is n – 1 degree of freedom for a sample with n scores
- The t statistic is used as a substitute for a z-score.
- To determine how well a t-statistic approximates a z-score, we must determine how well the sample variance approximates the population variance.
- The sample mean has to be known before computing sample variance. This places a restriction on sample variability such that only n – 1 score in a sample are independent and free to vary.
- The value n – 1 is called the degrees of freedom (or df) for the sample variance
Degrees of freedom ( df ) = n –1
- The larger the sample (n), the better the sample represents its population.
- The greater the value of df for a sample, the better the sample variance s2, and the better the t statistic approximates the z-score.
- The larger the Degrees of freedom associated with s2 and t approximates the z-score.
The t Distribution
A t distribution is the complete set of t values computed for every possible random sample for a specific sample size (n) or a specific degree of freedom (df). The t distribution approximates the shape of a normal distribution
- Every sample from a population can be used to compute a z-score or a t-statistic. If you select all the possible samples of a particular size (n), and compute the z-score for each sample mean, then the entire set of z-scores will form a z-score distribution.
- In the same way, you can compute the t statistic for every sample and the entire set of t values will form a t-distribution.
- Sample means tend to be a normal distribution if the sample size is large (around n = 30 or more) or if the sample is selected from a normal population,
- If the sample means is nearly perfect normal distribution,t distribution approximates a normal distribution,
- How well a t-distribution approximates a normal distributor is determined by degrees of freedom.
- The greater the sample size (n), the better the t distribution approximates the normal distribution. Refer to the below figure.

- The reason that the t distribution is flatter and more variable than the normal z-score distribution becomes clear if you look at the structure of the formulas for z and t. For both z and t, the top of the formula, x – μ, can take on different values because the sample mean (x) varies from one sample to another.
- For z-scores, the denominator 𝜎 m = 𝜎 / √𝑛 does not vary, if all the samples have the same sample size.
- For t statistics, the denominator is 𝜎sample / √𝑛 varies from one sample to another.
- The numerator (x-µ ) varies for both the t & z score
- For z-scores, only the numerator varies & the denominator does not vary.
- But for t statistics, both numerator & denominator vary, therefore t distribution curve is flatter and more spread out.
- Variability of t distribution decreases as sample size and df increase, and it resembles very close to a normal distribution.
Example: t distribution with df = 3
For α = 0.1
5% of the distribution is located in the tail beyond t = 2.353. Also, 5% is in the tail beyond t = –2.353. Thus, a total proportion of 10% (0.10) is in the two tails combined.

Probabilities for t Distribution
- The t distribution table does not include entries for every possible df value.
- For example, df = 45 and df = 55 but does not list any entries for df values between 45 and 55.
- In this situation see both of the surrounding df values listed and then use the larger value for t.
- If, for example, you have df = 49 (not listed), look up the critical t value for both df = 45 and df = 55 and then use the larger t value.
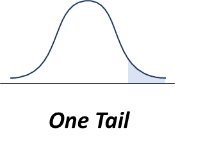
Probabilities for t Distribution: One Tail

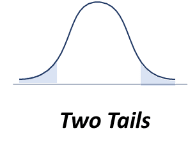
Probabilities for t Distribution: Two Tails

Also Read
- https://matistics.com/statistics-data-variables/
- https://matistics.com/descriptive-statistics/
- https://matistics.com/1-1-measurement-scale/
- https://matistics.com/point-biserial-correlation-and-biserial-correlation/
- https://matistics.com/2-0-statistics-distributions/
- https://matistics.com/1-2-statistics-population-and-sample/
- https://matistics.com/7-hypothesis-testing/
- https://matistics.com/8-errors-in-hypothesis-testing/
- https://matistics.com/9-one-tailed-hypothesis-test/
- https://matistics.com/10-statistical-power/
- https://matistics.com/11-t-statistics/
- https://matistics.com/12-hypothesis-t-test-one-sample/
- https://matistics.com/13-hypothesis-t-test-2-sample/
- https://matistics.com/14-t-test-for-two-related-samples/
- https://matistics.com/15-analysis-of-variance-anova-independent-measures/
- https://matistics.com/16-anova-repeated-measures/
- https://matistics.com/17-two-factor-anova-independent-measures/
- https://matistics.com/18-correlation/
- https://matistics.com/19-regression/
- https://matistics.com/20-chi-square-statistic/
- https://matistics.com/21-binomial-test/