What is Statistical Power?
- The power of a statistical test is the probability that the test will correctly reject a false null hypothesis.
- The power is defined as the probability that the test will reject the null hypothesis if the treatment has an effect.
- Power is the probability that the test will identify a treatment effect if its effect exists.
- An alternative approach for measuring effect size is to measure the power of the statistical test.
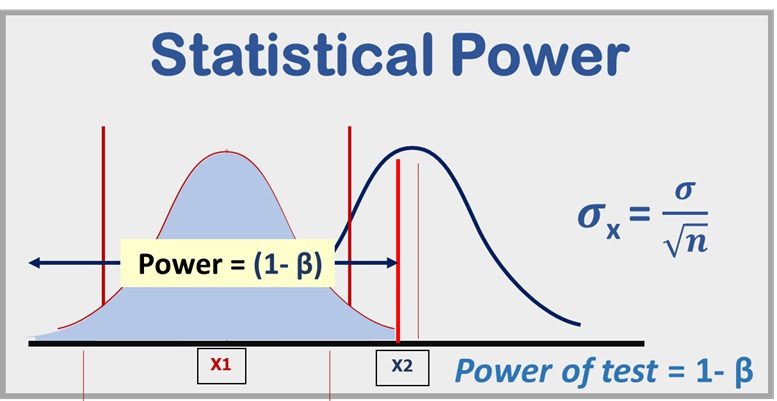
- To determine the power of a hypothesis test, you first identify the treatment and null distributions.
- The power of the hypothesis test is the portion of the treatment distribution, located beyond the boundary of the critical region.
- As the size of the treatment effect increases, statistical power increases. A one-tailed test has greater power than a two-tailed test.
- A large sample results in more power than a small sample.
Calculating Power
- Power is calculated as a means of Power of a hypothesis test is conducted before conducting the research study to determine whether a research study is likely to be successful (reject H0 )
- Factors that influence the outcome of a hypothesis test are sample size, the size of the treatment effect, and the value chosen for the alpha level.
- Whenever a treatment has an effect, there are only two possible outcomes for a hypothesis test:
A ⇒ either fail to reject H0
B ⇒ Or reject H0
Probability of A + Probability of B = 1
-
- Failing to reject H0 when there is a real effect, is defined as a Type II error with a probability identified as p = β.
- Rejecting H0 when there is a real effect, is the power of the test. Thus, the power of a hypothesis test is equal to 1 – β
Probability of A + Probability B = 1
β + Probability B = 1
Probability of B = 1- β
Power of test = 1- β
- The left-hand side shows the distribution of sample means that would occur if the null hypothesis were true. The critical region is defined for this distribution.
- The right-hand side shows the distribution of sample means obtained if there were an 8-point treatment effect. The sample mean is in the critical region. The probability of rejecting the null hypothesis (the power of the test) is nearly 100% for a treatment effect.
Calculate the exact value for the power of the test
- Determine what portion of the distribution on the right-hand side is shaded.

- Locate the exact boundary for the critical region,
- The critical boundary of z = +1.96 corresponds to a location, above the mean (550) by 1.96 standard deviations.
- σx = σ / sqrt(n) = 40/5 = 8
- Distance = 1.96 x σx = 1.96 x 8 = 15.68 points
- Value at z = +1.96 is = 550 + 15.68 = 565.68
- Any sample mean greater than 565.68 is in the critical region and will reject H0
- Find the probability value in the normal distribution table.
- For the treated distribution (right-hand side), the population mean is μ = 550 and a sample mean of 570 corresponds to a z-score of 2.5

- Use the unit normal table and determine p for z < + 2.5
p = 0.9938 or 99.38%.(from Unit Normal Table)

- The power of the test is 99.38 %

Factors affecting power
Power and Effect Size
- Power and effect size are related to the treatment effect.
- As the effect size increases, the distribution of sample Mean on the right-hand side moves even farther to the right so that more and more samples are beyond the z = 1.96 boundaries.
- As the effect size increases, the probability of rejecting H0 also increases, which means that the power of the test increases.
- Measures of effect size such as Cohen’s d and measures of power both indicate the strength or magnitude of a treatment effect
Sample Size
- One factor that hugely influences power is the size of the sample.
- Power for a 20-point treatment effect using a sample of n = 25.
- If Sample of n = 4, then the power would be

- Reducing the sample size to n = 4 has reduced the power of the test to less than 50% compared to the power of nearly 100% with a sample of n = 25.
-
- Power is directly related to sample size, one of the primary reasons for computing power is to determine what sample size is necessary to achieve a reasonable probability of a successful study.
- If the probability (power) is too small, the sample size can be increased to increase the probability (power).
Alpha Level
- Reducing the alpha level for a hypothesis test also reduces the power of the test. For example, lowering α from .05 to .01 lowers the power of the hypothesis test.
-
- Using α = .05, the Boundary would be on the right-hand side z = 1.96.
- Using α = .01 Boundary would be moved farther to the right, out to z = 2.58.
- Moving the critical boundary to the right means, there would be a lower probability of rejecting the null hypothesis and a lower value for the power of the test
One-Tailed vs. Two-Tailed Test
- If the treatment effect is in the predicted direction, changing from a regular two-tailed test to a one-tailed test increases the power of the hypothesis test.
- Critical region using a two-tailed test with α = .05 so that the Critical Region on the right-hand side begins at z = 1.96.
- Changing to a one-tailed test would move the critical boundary to the left to a value of z = 1.65. Moving the boundary to the left would cause a larger proportion of the treatment distribution to be in the critical region and, therefore, would increase the power of the test
Also Read
- https://matistics.com/statistics-data-variables/
- https://matistics.com/descriptive-statistics/
- https://matistics.com/1-1-measurement-scale/
- https://matistics.com/point-biserial-correlation-and-biserial-correlation/
- https://matistics.com/2-0-statistics-distributions/
- https://matistics.com/1-2-statistics-population-and-sample/
- https://matistics.com/7-hypothesis-testing/
- https://matistics.com/8-errors-in-hypothesis-testing/
- https://matistics.com/9-one-tailed-hypothesis-test/
- https://matistics.com/10-statistical-power/
- https://matistics.com/11-t-statistics/
- https://matistics.com/12-hypothesis-t-test-one-sample/
- https://matistics.com/13-hypothesis-t-test-2-sample/
- https://matistics.com/14-t-test-for-two-related-samples/
- https://matistics.com/15-analysis-of-variance-anova-independent-measures/
- https://matistics.com/16-anova-repeated-measures/
- https://matistics.com/17-two-factor-anova-independent-measures/
- https://matistics.com/18-correlation/
- https://matistics.com/19-regression/
- https://matistics.com/20-chi-square-statistic/
- https://matistics.com/21-binomial-test/