


Two sample t-statistics: Participants from Separate group
- The two sets of data could come from two completely separate groups of participants.
- The study may involve a sample of boys compared with a sample of men.
- The study may compare JEE results of one group of participants who are given computers, with grades for a second group who are not given computers

Prerequisite for better understanding
- Sample variance
- Standard error formulas
- The t statistic
- Distribution of t values
- df for the t statistic
- Estimated standard error
The Independent Samples t-test compares the means of two independent groups in order to determine whether there is statistical evidence that the associated population means are significantly different.
Two samples t-statistic | Independent or between-subjects design
A design that uses a separate group of participants for each treatment condition is called an independent-measures research design or a between-subjects design.


- The independent-measures t statistic is used for hypothesis testing.
- The difference between the two sample means (µsample1 − µsample2) is used as a basis for testing a hypothesis about the difference between the two population means (µ1 − µ2).
Example: Two-sample t-statistic an Independent Measure test
Population-1:
- Treatment: Vegetation diet + Daily exercise for six months,
- Population mean: Population mean before treatment is unknown (μ1 =?)
- Sample: As we cannot practically analyse the whole population after treatment, therefore random samples are selected for analysis


Population-2:
- Treatment: Sea Food + No exercise for six months,
- Population mean: Population mean before treatment is unknown (μ2 =?)
- Sample: As we cannot practically analyse the whole population after treatment, therefore random samples are selected for analysis
- Test: to determine any significant difference in health conditions among these two populations.


Two samples: t-statistic analysis:
- Used to compare the effect of treatment on population 1 and population 2.
- Samples are drawn from these two populations and a study is conducted.
- As per the sample statistics, the inference is taken about the population and whether there is no difference in health conditions of both populations
- Or there is a significant difference in the health of people of the two populations.
Summary


Independent-Measure Test:
The objective is to evaluate the mean difference between two populations (or between two treatment conditions) and conclude whether two population/treatment has a significant effect or whether the variation is only because of chance.
Null hypothesis
- The null hypothesis states that there is no effect, no difference or no change.
H0 : µ1 − µ2 = 0
(No difference between the population means)
- The null hypothesis could also be stated as
µ1 = µ2
The alternative hypothesis
- The alternative hypothesis states that there is a mean difference between the two populations,
H1 : µ1 − µ2 ≠ 0
(Both means are different. Change is because of treatment on population)
- The alternative hypothesis simply states that two population means are not equal:
µ1 ≠ µ2
Formula:
Two sample t-statistic: Independent-measure Hypothesis Test
- Remember the formula of one sample t statistic:-


- Refer above formula of ONE sample t statistics and re-write the below formula for TWO sample


- Sample statistic difference = difference between the mean of sample1 and sample2
= (µsample1 − µsample2)
- hypothesized Population parameter difference= µ1 – µ2
- Pooled estimated standard error = sp
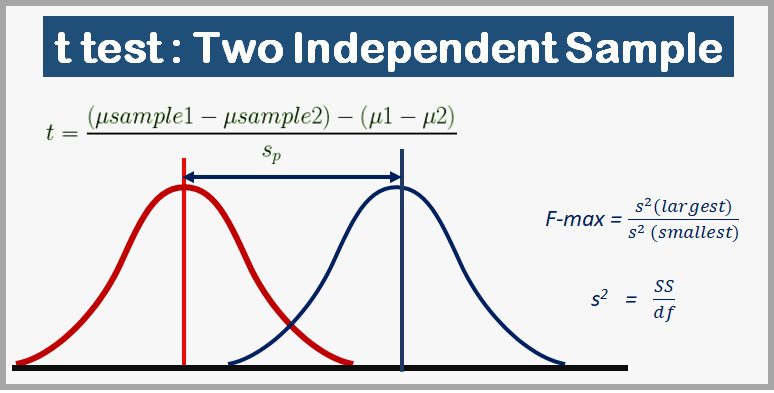
- t statistics =


- Considering H0 : µ1 – µ2 =0


t statistics


Estimated standard error Formula – Independent-Measures Hypothesis Test
- The standard deviation of sample 1 = s1
- The Standard estimated of sample 2 = s2


- Add the above two errors together to get a total Estimated standard error for two samples Independent-Measures Hypothesis tests. The resulting formula for standard error is


Two sample t-statistics: Degrees of Freedom
- df for the t statistic = df for the first sample + df for the second sample


Two sample t-statistics: Steps for the hypothesis test
- The independent-measures t statistic uses the data from two separate samples to help decide whether there is a significant mean difference between two populations or between two treatment conditions.
A complete example of a hypothesis test with two independent samples is as follows
Step 1: State the hypotheses and select the alpha level.
H0 : µ1 − µ2 = 0 (No difference.)
H1: µ1 − µ2 ≠ 0 (There is a difference.)
- set α = .05. Directional hypotheses could be used and would specify whether the students who were tested in a dimly lit room should have higher or lower scores
Step 2: This is an independent-measures design.
The t statistic for these data has degrees of freedom determined by
df = df1 + df2
df = n1 + n2 – 2
-
- n1= sample size of sample-1
- n2= sample size of sample-2
Step 3: Calculate the test statistic.
Calculate t :


Step4: Make a decision
- If the obtained value t is in the critical region. Reject H0 and conclude that there is a significant difference
- If the obtained value t is not in the critical region. Accept H0 and conclude that there is no difference, both are the same.


Two sample t-statistic: Assumptions
- The observations within each sample must be independent
- The two populations from which the samples are selected must be normal
- The two populations from which the samples are selected must have equal variances
Two sample t-statistic: Hartley’s F-Max Test
- If the two population variances are equal, then the two sample variances should be very similar. When the two sample variances are reasonably close, you can be reasonably confident that the homogeneity assumption has been satisfied and proceed with the test.
- If one sample variance is more than three or four times larger than the other, then there is a reason for concern. A more objective procedure involves a statistical test to evaluate the homogeneity assumption.
- Hartley’s F-max test is one of the simplest to compute and understand homogeneity of variance with more than two independent samples.
- The F-max test is based on the principle that a sample variance provides an unbiased estimate of the population variance. The null hypothesis for this test states that the population variances are equal, therefore, the sample variances should be very similar. The procedure for using the F-max test is as follows:
- Compute the sample variance for each of the separate samples

- Select the largest and the smallest of these sample variances and compute F


- A relatively large value for F-max indicates a large difference between the sample variances. In this case, the data suggest that the population variances are different and that the homogeneity assumption has been violated.
- On the other hand, a small value of F-max (near 1.00) indicates that the sample variances are similar and that the homogeneity assumption is reasonable
- The F-max value computed for the sample data is compared with the critical value found in Table.
Two sample t-statistic: F-max value Table


- If the sample value is larger than the table value, you conclude that the variances are different and that the homogeneity assumption is not valid. To locate the critical value in the table, you need to know
-
- k = the number of separate samples. (For the independent-measures t-test, k = 2)
- df = n − 1 for each sample variance.
- The Hartley test assumes that all samples are the same size.
- The alpha level. The table provides critical values for α = .05 and α = .01.
Two sample t-statistic: effect size estimate: Cohen’s d
Effect measurement is defined by Cohen’s d :
- The difference between the two sample means (x1-x2) is used as the best estimate of the mean difference between the two populations,
- Pooled standard deviation (the square root of the pooled variance) is used to estimate the population standard deviation :


- The formula for estimating Cohen’s d


Two sample t-statistics: effect size estimate by r2
It is identified as r2.
Cohen proposed criteria for evaluating the size of a treatment effect that is measured by r2.


Cohen’s standards for interpreting r2 are shown in below Table


Two sample t-statistics:Confidence Intervals
Measurement : estimating µ1 – µ2
- A confidence interval is an alternative method for measuring and describing the size of the treatment effect.
- The sample means difference (µsample1-µsample2) is used to estimate the population mean difference ( µ1 − µ2).
(µsample1-µsample2) = µdiff
![]()

Two sample t statistics: Reporting the Results
There is a prescribed format for reporting the calculated value of the test statistic,
- Degrees of freedom,
- α Alpha level for the t-test.
- t value
- Confidence Interval
- p- probability value (Acknowledges the possibility/probability of a Type I error)
Also Read
- https://matistics.com/statistics-data-variables/
- https://matistics.com/descriptive-statistics/
- https://matistics.com/1-1-measurement-scale/
- https://matistics.com/point-biserial-correlation-and-biserial-correlation/
- https://matistics.com/2-0-statistics-distributions/
- https://matistics.com/1-2-statistics-population-and-sample/
- https://matistics.com/7-hypothesis-testing/
- https://matistics.com/8-errors-in-hypothesis-testing/
- https://matistics.com/9-one-tailed-hypothesis-test/
- https://matistics.com/10-statistical-power/
- https://matistics.com/11-t-statistics/
- https://matistics.com/12-hypothesis-t-test-one-sample/
- https://matistics.com/13-hypothesis-t-test-2-sample/
- https://matistics.com/14-t-test-for-two-related-samples/
- https://matistics.com/15-analysis-of-variance-anova-independent-measures/
- https://matistics.com/16-anova-repeated-measures/
- https://matistics.com/17-two-factor-anova-independent-measures/
- https://matistics.com/18-correlation/
- https://matistics.com/19-regression/
- https://matistics.com/20-chi-square-statistic/
- https://matistics.com/21-binomial-test/