What is Hypothesis Testing?
- It is practically impossible to observe every individual in a population. Therefore, samples are collected to analyse population behaviour.
- Hypothesis testing is a statistical procedure that helps us to draw inferences about the population by using sample data.

- A hypothesis test is a method of making decisions or inferences from sample data (evidence)
- A hypothesis test is a statistical method that uses sample data to evaluate a hypothesis about a population.
- Hypothesis testing is one of the most commonly used inferential procedures. Details of a hypothesis test change from one situation to another, but the general process remains constant.
- Concepts of z-scores, probability & sample mean are used to create a new statistical procedure known as a hypothesis test.
Steps of a Hypothesis Test
(a)Collect data and compute sample statistics.
- The raw data from the sample are summarized with the appropriate statistics
- Compute the sample mean. Now it is possible to compare the sample mean (the data) with the null hypothesis.
Now we calculate a z-score that identifies where our sample mean is located in this hypothesized distribution. The z-score formula for a sample mean


- In place of the Z score, other statistical scores (t score etc.) can also be calculated depending on the nature of the distribution of data.
(b)State the hypothesis
- State a hypothesis about the unknown population.
- We state two opposing hypotheses.
The null hypothesis (H0 )
- The null hypothesis states that there is no change, no effect, no difference, and nothing happened, hence the name null.
- The null hypothesis states that the treatment has no effect.
- It assumes that in the general population, there is no change, no difference, or no relationship.
- In the context of an experiment, H0 predicts that the independent variable (treatment) has no effect on the dependent variable (scores) for the population.
- The null hypothesis is identified by the symbol H0. (The H stands for hypothesis, and the zero subscripts indicate that this is the zero-effect hypothesis.)
Hypothesis H0:
-
-
- The sample mean = Population mean
- μsample = μpopulation
-
The alternative hypothesis (H1 )
- The second hypothesis is simply the opposite of the null hypothesis, and it is called the scientific, or alternative, hypothesis (H1 ).
- It states that there is a change, a difference, or a relationship for the general population.
- This hypothesis states that the treatment has an effect on the dependent variable
Hypothesis H1:
-
-
-
- μsample ≠ μpopulation
-
-
- In the context of an experiment, H1 predicts that the independent variable (treatment) does have an effect on the dependent variable.
Examples: Null & Alternate Hypothesis test
Example1:
- Doctors want to find out if the new medicine will have any side effects. The parameters considered for understudy were the pulse rate of the patients who have taken the medicine.
What are the hypotheses to test whether the pulse rate will be different from the mean pulse rate of 82 beats per minute?
-
-
- Null Hypothesis: H0 μ = 82
- Alternate Hypothesis: H1 μ ≠ 82
-
Example2:
- The engineer wants to reduce the electricity bill by using a spray type of desert cooler in summer in houses. If the average monthly Electric bill is Rs 1500 per month.
What are the hypotheses to test whether the electric bill will be different from the average electric bill of Rs 1500 per month?
-
-
- Null Hypothesis: H0 μ =1500
- Alternate Hypothesis: H1 μ ≠ 1500
-
Example3:
- The engineer invents an electric circuit to increase the average (Petrol consumed in Liter per KM travel) of a motorcycle. If the average before fitting the device was 55 KM/litre,
What are the hypotheses to test whether the Motorcycle average will be different from the average of 55 KM/litre?
-
-
- Null Hypothesis: H0 μ =55
- Alternate Hypothesis: H1 μ ≠ 55
-
(c)Set the criteria for a decision
- Data from the sample is used to evaluate the reliability of the null hypothesis.
- The data will either provide support for the null hypothesis or tend to disprove the null hypothesis.
- First select a specific probability value, which is known as the level of significance, or the alpha level, for the hypothesis test.
- By convention, commonly used alpha levels are
-
-
- α = .05 (5%)
- α = .01 (1%)
- α = .001 (0.1%).
-
-
- For example, with α = .05, we separate the most unlikely 5% of the sample means (the extreme values) from the most likely 95% of the sample means (the central values)
- The alpha (α) value is a small probability that is used to identify the low-probability samples.
- With the help of the alpha-level decision, boundaries are calculated.
The Alpha Level
- The alpha level, or the level of significance, is a probability value that is used to define the concept of “very unlikely” in a hypothesis test.
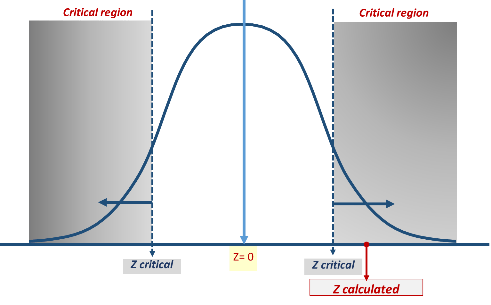
- The critical region is composed of the extreme sample values, that are very unlikely (as defined by the alpha level) to be obtained if the null hypothesis is true.
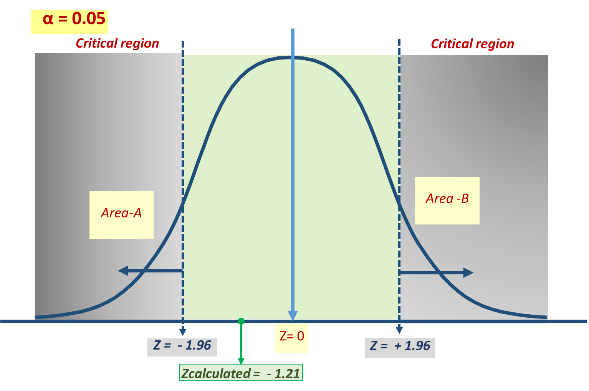
- See the below figure, α = Area A + Area B. This area is represented in grey colour. It is called a critical region. Corresponding critical values are calculated from the α level.

- The boundaries for the critical region are determined by the alpha level. If sample data fall in the critical region, the null hypothesis is rejected
- If Z calculated value is within the critical zone – Hypothesis H0 will be rejected
- Example1: for α = 0.05, Zcritical = -1.96 & Zcritical = +1.96
-
- Zcalculated = -2.65, it is below the Zcritical = – 1.96
- It falls inside the critical region.
- Hence H0 is rejected.
-

- Example2: for α = 0.05, Zcritical = -1.96 & Zcritical = +1.96
-
- Zcalculated = + 2.01 , it is above the Zcritical = + 1.96
- It falls inside the critical region
- Hence H0 is rejected
-

If Z calculated value is outside the critical zone – Hypothesis H0 will be accepted
- Example3: for α = 0.05, Zcritical = -1.96 & Zcritical = +1.96
-
- Zcalculated = -1.21, it is above the Zcritical = – 1.96
- It falls outside the critical region
- Hence H0 is accepted
-
(d)Determine critical region boundaries of separation
For α = .05, determine critical region boundaries
- With α = .05, for example, the boundaries separate the extreme 5% from the middle 95%. Because the extreme 5% is split between two tails of the distribution, there is exactly 2.5% (or 0.0250) in each tail.
- Explanation of α = .05 in terms of Probability distribution:-

- Explanation of α = .05 in terms of Area under Probability distribution curve:-

- Explanation of α = .05 on Normal distribution curve (Probability distribution curve):-

In the normal Z table, look up a proportion of 0.0250 in the column and find the z-score value.
- For α = .0250 , z = 1.96
- For any normal distribution, the tails of the distribution are beyond z = +1.96 and z = –1.96. values define the boundaries of the critical region for a hypothesis test using α = .05
For α = .01, determine critical region boundaries
- An alpha level of α = .01 means that 1% or .0100 is split between the two tails.
- Explanation of α = .01 in terms of Probability distribution:-

- Explanation of α = .01 in terms of the Area of the Probability distribution curve:-

- Explanation of α = .01 on Normal distribution curve (Probability distribution curve):-

- In the normal Z table, look up a proportion of 0.005 in the column and find the z-score value.
- For α = .005 , z = 3.30
- For any normal distribution, tails of the distribution beyond z = +3.30 and z = –3.30, values define the boundaries of the critical region for a hypothesis test using α = .01
(e)Make a decision: about the Hypothesis
Condition 1: The sample data outside the critical region.

- If the Z calculated value is in the Critical Zone, the sample is not consistent with H0 and the decision will be to reject the null hypothesis.
- The sample mean is reasonably away from the population mean
- Rejecting H0 concludes that:
- Treatment did have an effect, on the sample wrt population
- There is a change in the sample in comparison to the population
- There is a difference in a sample from the population etc.
Condition 2: The sample data are located within the critical region.

- If Z calculated value is NOT in the Critical zone, sample data do not provide strong evidence that the null hypothesis is wrong, our conclusion is to accept the null hypothesis H0
- In this case, the sample mean is reasonably close to the population mean
- This conclusion means that :
- Treatment did NOT have an effect, on the sample wrt population
- There is NO change in the sample in comparison to the population
- There is NO difference in a sample from the population etc.
Refer: ENGINEERING STATISTICS HANDBOOK (NIST)
Also Read
- https://matistics.com/statistics-data-variables/
- https://matistics.com/descriptive-statistics/
- https://matistics.com/1-1-measurement-scale/
- https://matistics.com/point-biserial-correlation-and-biserial-correlation/
- https://matistics.com/2-0-statistics-distributions/
- https://matistics.com/1-2-statistics-population-and-sample/
- https://matistics.com/7-hypothesis-testing/
- https://matistics.com/8-errors-in-hypothesis-testing/
- https://matistics.com/9-one-tailed-hypothesis-test/
- https://matistics.com/10-statistical-power/
- https://matistics.com/11-t-statistics/
- https://matistics.com/12-hypothesis-t-test-one-sample/
- https://matistics.com/13-hypothesis-t-test-2-sample/
- https://matistics.com/14-t-test-for-two-related-samples/
- https://matistics.com/15-analysis-of-variance-anova-independent-measures/
- https://matistics.com/16-anova-repeated-measures/
- https://matistics.com/17-two-factor-anova-independent-measures/
- https://matistics.com/18-correlation/
- https://matistics.com/19-regression/
- https://matistics.com/20-chi-square-statistic/
- https://matistics.com/21-binomial-test/